Last updated on Wed, 14th Sep 2022
I thought I’d share with you the tracking spreadsheet I created for monitoring my weight loss.
This spreadsheet was created using Microsoft Excel 2010, so it should work with that version or more recent versions. I haven’t tested it with Excel 2007.
Recording Weigh-ins

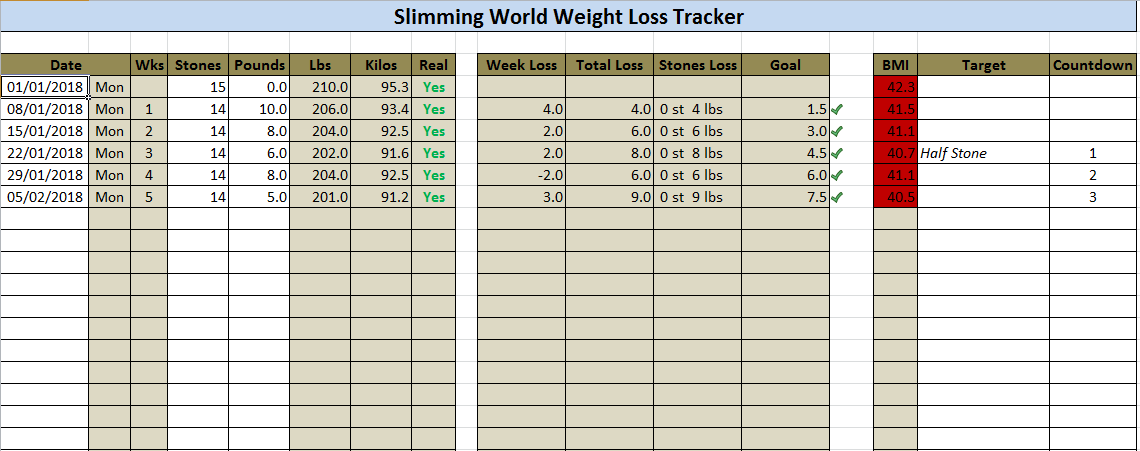
The chart allows you to record your weekly weigh-ins in order to track progress. You enter data into the cells that have a white background, and all the values with a coloured background are calculated.
Each week enter:
- Date – the day of the week and the number of weeks is then automatically calculated
- Weight in stones and pounds – the equivalent in pounds and kilos is automatically calculated. If the date is also in the past then the recording is marked as ‘Real’ – to distinguish from any projected losses you might enter
- Optionally record any target/award or countdown information that might apply.
The first line is your starting weight, so make sure that’s entered correctly.
The spreadsheet will calculate your weekly loss (the difference in weight from the previous line) and total loss to date (in both pounds and stones/pounds). It’ll also tell monitor your progress against a weekly loss goal (e.g. 2 lbs a week), and your current BMI value.
The chart

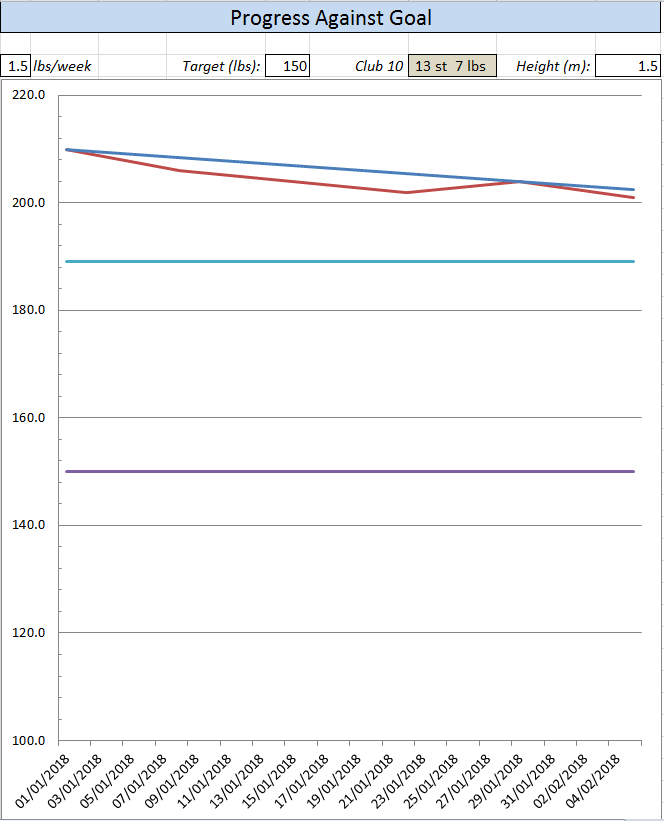
Above the chart you can enter your weekly weight loss goal – how much you’d like to lose per week. That’s used to plot a goal line on the chart – the blue line. Your actual weight loss is the red line.
Your Target is your PAT, and is shown as the purple line.
Your Club 10 value is automatically calculated and is shown as the cyan line
The height value needs to be set correctly (in metres) to calculate your BMI value.
The chart automatically updates whenever you enter new weight information.
UPDATE: In response to a number of requests I’ve updated the Excel to remove the protection, so anyone should be able to download the latest version and edit/amend/extend it to their heart’s content. Enjoy!

There’s a similar weight loss tracker on the Slimming World website including a graph showing progress
It’s not as good as mine!
This is really fantastic, Thank you! I’d like to add extra pages for tracking measurements and food diaries etc but the file is password protected – would you consider allowing me to unlock it so i can do this?
Hi Mari-Claire – I’ve just sent you an email about this. I’d be interested to hear about the changes you make.
Hi Richard,
This is great! like Mari-Claire I would like to add pages as I have a group of friends all doing it and we would love to track all of our weights on one page? Could you help with this?
This is amazing, Am i able to get the password so i can add some extra rows etc? thank you so much for this its exactly what ive been looking for
Hi Richard
Would be great to be able to edit this so i can add some measurement tracking too
Also so i can extend the timeline a bit as the formula doesnt go all the way down ro row 37. Column U stops at 31
Hi there. In response to all the requests I’ve received to get access to the password to make changes to the spreadsheet, I’ve instead uploaded a new version of the Excel with the workbook protection turned off. If you download this latest version you should be able to edit the spreadsheet for your own needs.
Thank you so much for taking the time to create this spreadsheet and especially thank you for sharing it on the web. It’s exactly what I’ve been looking for. You are a star!
Thank you – your spreadsheet will be a great help to me
Thanks for the spreadsheet its great… can you tell me what the ticks and crosses represent and the real and countdown columns 🙂
Hi Caroline, the ticks/crosses give an indication if you’re meeting your weight loss goal (e.g. 2 lbs a week). Basically if ‘Total Loss’ is greater than ‘Goal’ then you get a tick, and if it’s less than you get a cross!